


The Restaurant Industry's Growing Over-Capacity Problem
Why Unit Growth Outpacing Population Matters


Overview
Restaurant industry unit growth is systematically outpacing population growth, creating a less than zero-sum game when it comes to competing for share of stomach. BLS data shows units increasing 17.3% by 2030 compared to just 6.5% population growth, driving a projected 9.2% decline in the population base per restaurant. This structural imbalance is one factor that helps to explains the Q1 2025 same store traffic declines (-3.2%) despite strong nominal sales growth, and suggests operators must fundamentally rethink their approach to competitive intrusion. When unit growth exceeds population growth, same-store metrics inevitably face pressure, raising the bar brand strength or marketing investment.
The restaurant industry faces a fundamental math problem that's rarely discussed in quarterly earnings calls or industry conferences. While headlines focus on same-store sales growth and inflation-adjusted consumer spending, a more structural issue lurks beneath the surface: the steady dilution of the population base per restaurant across America.
Population Per Restaurant: A Critical Metric
Government data from multiple sources reveals a concerning trend: the population base per restaurant nationally has decreased from 568 people per restaurant in 2019 to 531 people per restaurant by 2025. This 6.5% reduction in the available customer pool per establishment creates an increasingly competitive landscape where restaurants must fight harder for essentially the same number of potential customers.
This metric deserves far more attention than it typically receives. When the universe of dining options expands faster than the population, the fundamental unit economics of restaurant operations face increasing pressure - regardless of how much consumers spend in aggregate.
Revenue Growth vs. Real Growth
A critical lens for understanding the industry's true health is distinguishing between nominal and real growth. The charts below, based on government data, reveal a stark contrast between headline figures and economic reality:
Total Food-Away-From-Home Sales (Nominal vs. Real)
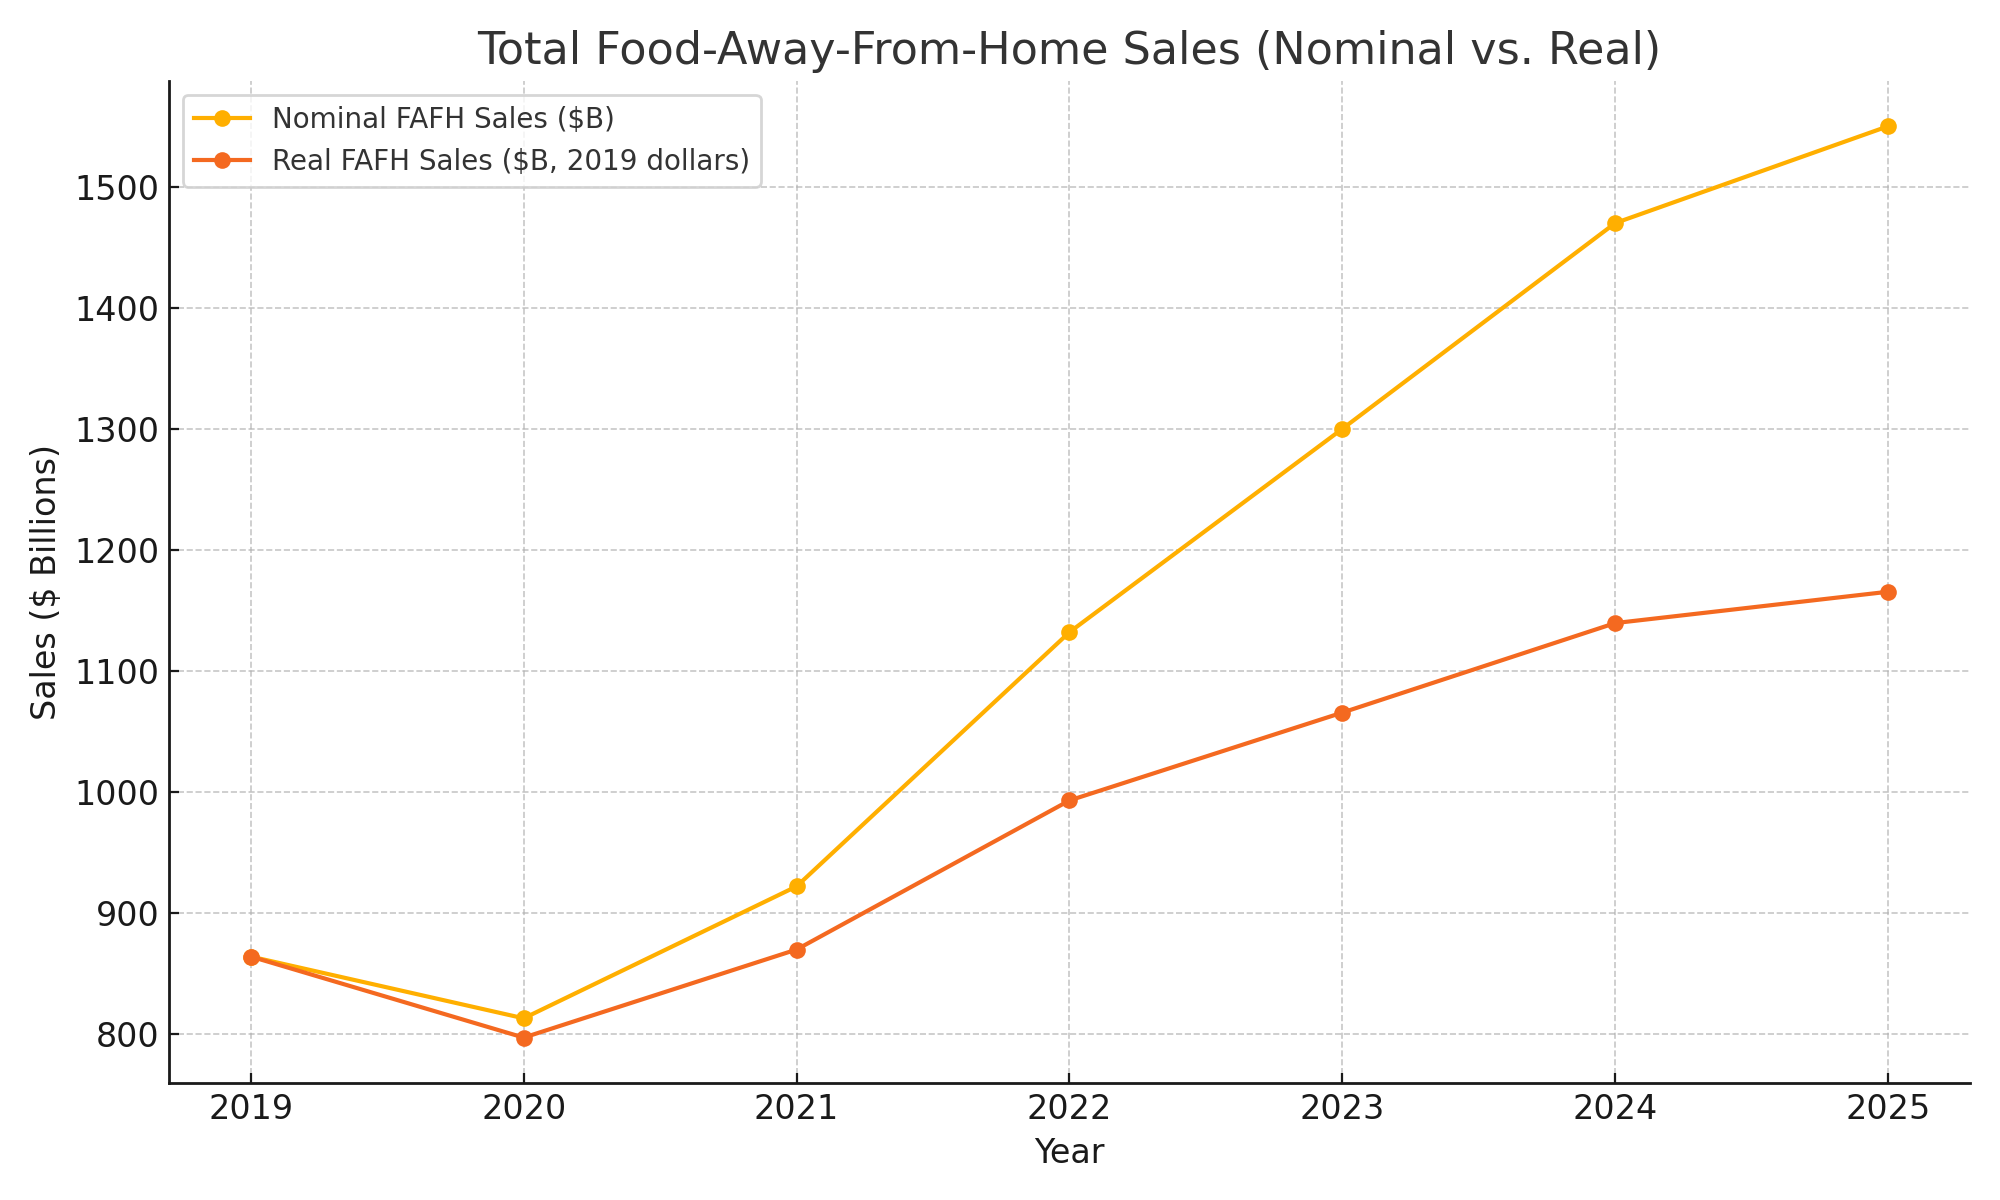
While nominal sales show an impressive 79% growth from 2019 to 2025, inflation-adjusted sales increased by only 35% in real terms. This means much of the apparent growth is price-driven rather than volume-driven.
Per Capita Food-Away-From-Home Spending (Nominal vs. Real)

Per capita spending increased from $2,632 in 2019 to $4,559 in 2025, but only 30% of this growth represents increased consumption in real terms. This indicates consumers are paying more for similar levels of restaurant usage.
Average Sales per Restaurant Unit (Nominal vs. Real)

Average sales per restaurant unit rose 62% nominally from 2019 to 2025, but just 22% after adjusting for inflation. This modest real growth in per-unit sales, combined with declining traffic, suggests that price increases rather than volume growth are driving revenue gains.
Divergent Growth Estimates
The challenge in precisely quantifying this trend lies in the varied methodologies government agencies use to count restaurants. The estimates from 2019 to 2023 tell different stories:
Bureau of Labor Statistics (BLS QCEW): From ~577,778 to ~617,450 (+6.9%)
Census Bureau County Business Patterns: From ~660,000 to ~700,000 (+6.1%)
Yelp Listings: From ~700,000 to ~730,000 (+4.3%)
Google Maps: From ~800,000 to ~820,000 (+2.5%)
Even using the most conservative growth figure, restaurant units are expanding faster than the U.S. population, creating a mathematical certainty: fewer potential customers per establishment.
Restaurant Unit Growth vs. Population Growth: The Data
The table below provides a comprehensive view of restaurant unit growth from different data sources compared to population growth, with all metrics indexed to 2019 = 100 for clear comparison:
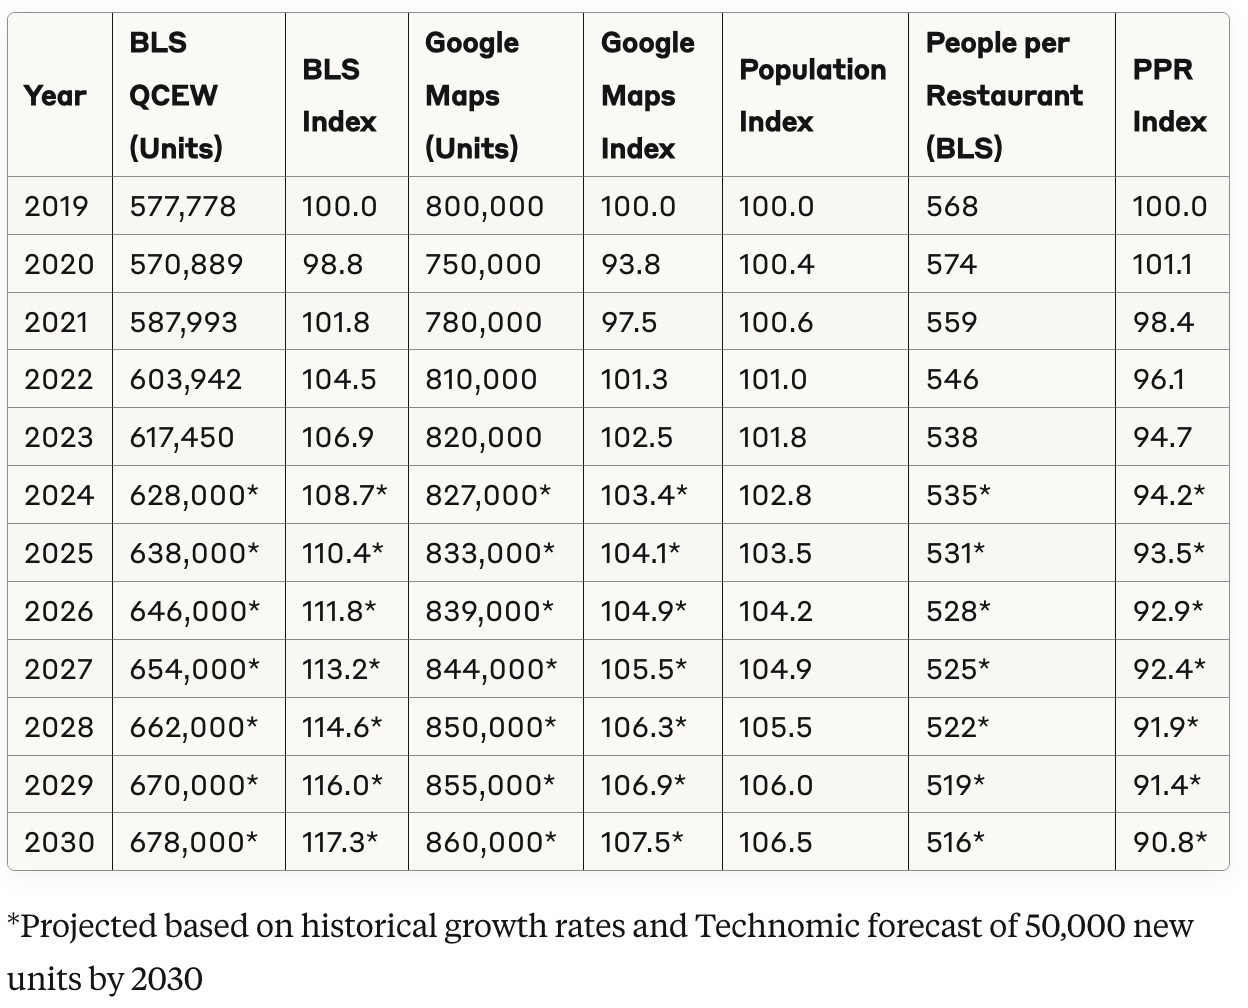
*Projected based on historical growth rates and Technomic forecast of 50,000 new units by 2030
Note: The discrepancy in the drop in units in 2020, with the BLS showing more stability compared to Google Maps data, is likely due to units that closed but maintained business registrations in anticipation of reopening. Furthermore, the mix of restaurant types changed significantly after 2019, with substantial growth in limited-service restaurants while many full-service establishments closed and never reopened.
Market Segmentation Analysis: Uneven Impact Across Formats
The capacity challenge is not affecting all restaurant segments equally. Current data reveals distinct patterns in both unit growth and traffic resilience across formats. The regional and local differences are even more extreme, but that’s for another day:
Unit Growth by Segment
Fast-Food/QSR: Leading expansion at 0.8% annual growth
Independent Full-Service: Moderate growth at 0.6% annually
Fine Dining: Slowest growth at just 0.3% annually
Traffic Resilience by Segment (Q1 2025)
QSR: Experiencing steepest traffic declines (-3.1% to -4.1%)
Fast Casual: Showing relative resilience (0.0% to -1.1%)
Casual Dining: Moderate declines (-1.5%)
Snack & Beverage: Significant vulnerability (-3.2%)
This segmentation reveals a counterintuitive pattern: QSR concepts are simultaneously leading in unit expansion while experiencing the most pronounced traffic declines. This suggests that the QSR segment may be approaching saturation more rapidly than other formats, with new units increasingly cannibalizing existing store traffic.
Fast Casual's relative resilience likely stems from several factors: more differentiated positioning, less direct substitutability, and potentially better site selection in less saturated trade areas. The comparative strength of Fast Casual in this environment suggests the segment may continue to gain share from both QSR and Casual Dining as the capacity challenge intensifies.
The Virtual Concept Blind Spot
The official statistics likely understate the true competitive dynamics. Ghost kitchens and digital-only brands that operate from existing restaurant infrastructures create additional competitive pressure without necessarily appearing in traditional unit count metrics.
Government sources like BLS QCEW and Census only "partially" capture ghost kitchens in their data, while digital platforms like Yelp and Google more fully reflect this growing segment. This means the actual dilution of the population base per "restaurant concept" is likely even more severe than the official numbers suggest.
Same Store Traffic Trouble of 2025
The consequences of this structural issue are becoming increasingly evident. After the growth trends of 2023-2024, Q1 2025 data shows a pronounced reversal:
Customer count decline of -2.8% year-over-year
Foot traffic decline of -3.2% year-over-year
Per-store traffic declines across all segments, with an average decline of -3.9%
This isn't simply a temporary demand fluctuation - it's the natural result of a market where supply (restaurant units) has outpaced population growth for years, finally reaching a tipping point.
Segment and Regional Variations
The data shows QSR concepts experiencing the steepest traffic declines (-3.1% to -4.1% depending on region), while Fast Casual demonstrates relative resilience with traffic changes ranging from flat to -1.1%.
Regional variations are equally telling, with the South showing the most pronounced traffic declines (-3.8%) while the West demonstrates comparative resilience (-2.4%). These differences likely reflect varying levels of restaurant unit saturation relative to population growth in different regions.
Operator Implications: Strategic Responses to Increasing Density
Restaurant operators face a fundamentally different strategic landscape when unit growth outpaces population growth that won’t be addressed by the traditional marketing playbook. The following approaches can help navigate this structural challenge:
1. Trade Area Analysis Beyond Traditional Metrics
Standard site selection models typically evaluate income, daytime population, and competitive intensity within set radii. In the current environment, operators should add:
Forecast Density Analysis: Track planned unit growth vs. population growth in the trade area over the next 24-36 months
Population Base per Restaurant Metric: Calculate and monitor changes in this ratio by trade area. The most accurate methods use mobile data for tight estimation of ‘true trade area population’ (www.signalflare.ai)
Saturation Index: Develop internal benchmarks for maximum sustainable restaurant density by format
2. Selective Growth in Under-penetrated Markets
Not all growth is equal in this environment. Prioritize:
Population Growth Corridors: Target areas where population is growing faster than restaurant units
Format Gaps: Identify markets where your segment is under-penetrated relative to population
Replacement vs. Net New: Consider investing in existing unit remodels/rebuilds rather than net new locations in saturated markets
3. Enhanced Traffic Capture Strategies
As competition for the same customer pool intensifies:
Daypart Expansion: Develop offerings for underutilized dayparts to maximize yield per square foot
Enhanced Geographic Targeting: Millions of dollars are wasted on traditional and digital advertising that fails to adequately target geographies that can actually drive customers when and where they are potential customers.
Menu Innovation for Incremental Visits: Create offerings that drive new visit occasions rather than just switching behavior (reach expansion)
4. Efficiency Optimization for Lower Break-Even Points
With traffic pressure structural rather than temporary:
Format Evolution: Consider smaller footprints with lower operating costs
Labor Optimization: Invest in systems that maintain quality with reduced labor inputs
Delivery/Off-Premise Optimization: Ensure off-premise channels are truly incremental and profitable
The Same-Store Sales Challenge
This framework explains why same-store sales growth has been tenuous with mixed results across the industry. For established restaurant chains, maintaining positive same-store sales becomes increasingly challenging when:
The population base per restaurant is steadily shrinking due to growing competition and anemic population growth
Virtual concepts create additional competition not fully captured in unit counts
Inflation-adjusted spending per capita shows only modest real growth
Even with the growth in capita spending in real terms, the proliferation of both physical and virtual restaurant concepts means that dollar volume is spread across more business units - making go-forward same-store performance increasingly difficult to maintain.
Measurement Framework: Key Metrics for Capacity Assessment
Industry participants need better tools to evaluate capacity dynamics. The following metrics should be tracked regularly:
Industry-Level Metrics - 6 Year Trend
Population Base per Restaurant: Total population divided by total restaurant units (national, state, and metropolitan area)
Restaurant Density Ratio: Units per 100,000 population (currently 188, up from 176 in 2019)
Real vs. Nominal Growth Gap: The difference between inflation-adjusted and nominal metrics (currently 44% for total sales)
Traffic to Sales Gap: The difference between traffic growth and sales growth (signals reliance on pricing)
Company-Level Metrics
Trade Area Saturation Ratio: Population within trade area divided by restaurant units in that area
Customer Acquisition Cost (CAC): Marketing spend divided by new customer acquisition (should be monitored for trend)
Traffic Share vs. Unit Share: Compare your traffic share to your share of units in a market
Cannibalization Rate: Traffic impact on existing units when opening new locations
Evaluation Framework
Healthy Markets: Population base per restaurant stable or growing, CAC stable, nominal and real growth aligned
Cautionary Markets: Population base per restaurant declining 0-5% annually, CAC rising, widening gap between nominal and real metrics
Saturated Markets: Population base per restaurant declining >5% annually, rising CAC, traffic declines despite sales growth
This framework provides a structured approach to evaluating both industry trends and specific market dynamics, helping operators make more informed decisions about expansion and capital allocation.
Looking Forward: The Unit Growth Reckoning
For industry stakeholders, these trends suggest a necessary recalibration of expansion strategies:
Operators: Must consider market saturation metrics beyond traditional trade area analyses
Investors: Should question unit growth targets that exceed population growth in already saturated markets
Analysts: Need to incorporate population-to-restaurant ratios into same-store sales performance expectations
The coming years will likely bring a market correction as operators respond to these structural challenges. The most successful players will be those who recognize that the population base per restaurant is a fundamental constraint that will make all but the most exceptional operators vulnerable.
In an industry where unit growth has long been celebrated as a sign of health, we may be entering an era where strategic restraint in expansion becomes the wiser path forward. A bad news for emerging brands banking on massive expansion plans.
Great analysis as always